SVG bar chart
tutorial
source
Bar chart tutorial updated fom version 3 with some additional style
Simple bar chart
tutorial
source
Bar chart tutorial updated fom version 3 with some additional style
Vertical SVG bar chart
tutorial
source
Bar chart tutorial updated fom version 3 with some additional style
General update pattern
tutorial
source
This example demonstrates D3’s general update pattern, where a data-join is followed by operations on the enter, update and exit selections.
Nested Selections
tutorial
source
D3’s selections can be hierarchical, much like the elements and data they join.
Axis Styling
tutorial
source
This example shows how to customize the appearance of d3-axis using post-selection: modifying the contents of the SVG elements created by the axis.
Stacked to grouped bars
example
source
Animations can preserve object constancy, allowing the reader to follow the data across views.
Force-Directed Graph
example
source
This example demonstrates a force-directed graph computed using d3-force.
sxywu/react-d3-example
example
source
*warning: these are not meant to be good examples of data visualizations, but just to show the possibility of using D3 and React*
Force tutorial
experiment
Erperiments with the force-directed-graph. Nodes can be clicked, additional info will be displayed. Links are represented as arrow, to differentiate the direction of relations
Letter analysis
experiment
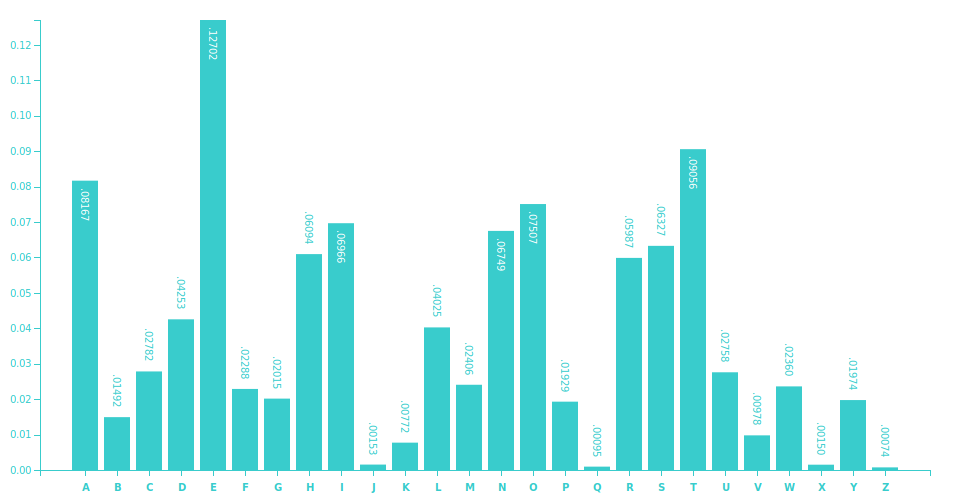
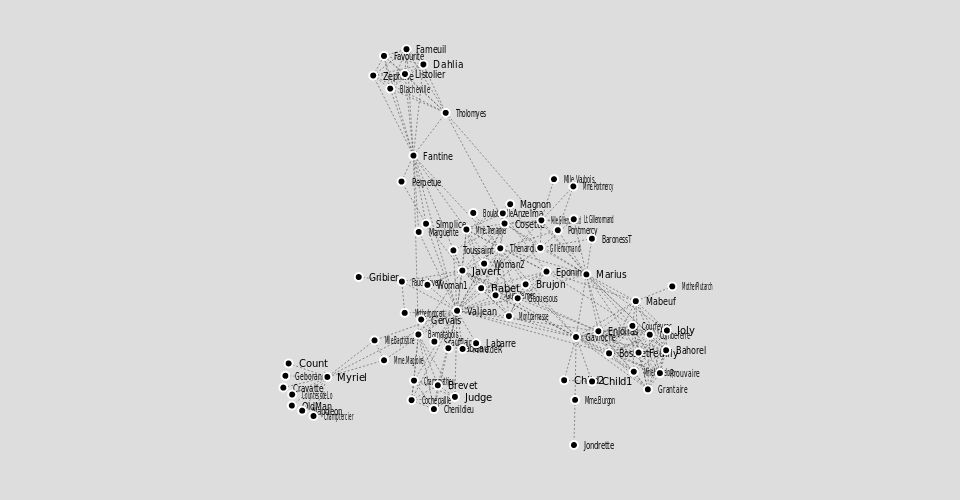
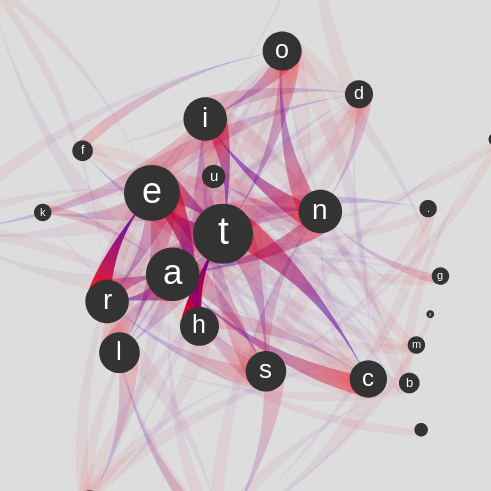
This example takes any string as input, but only latinic caracters will be taken to account. The graph displays the order of the letters, so that character X was followed by character Y. The handling of the repetitions and the bi-directional links are made with custom functions.
D3 examples